Sound Check
How To Treat or Manage Hearing Loss
Primary Care
Personal Care
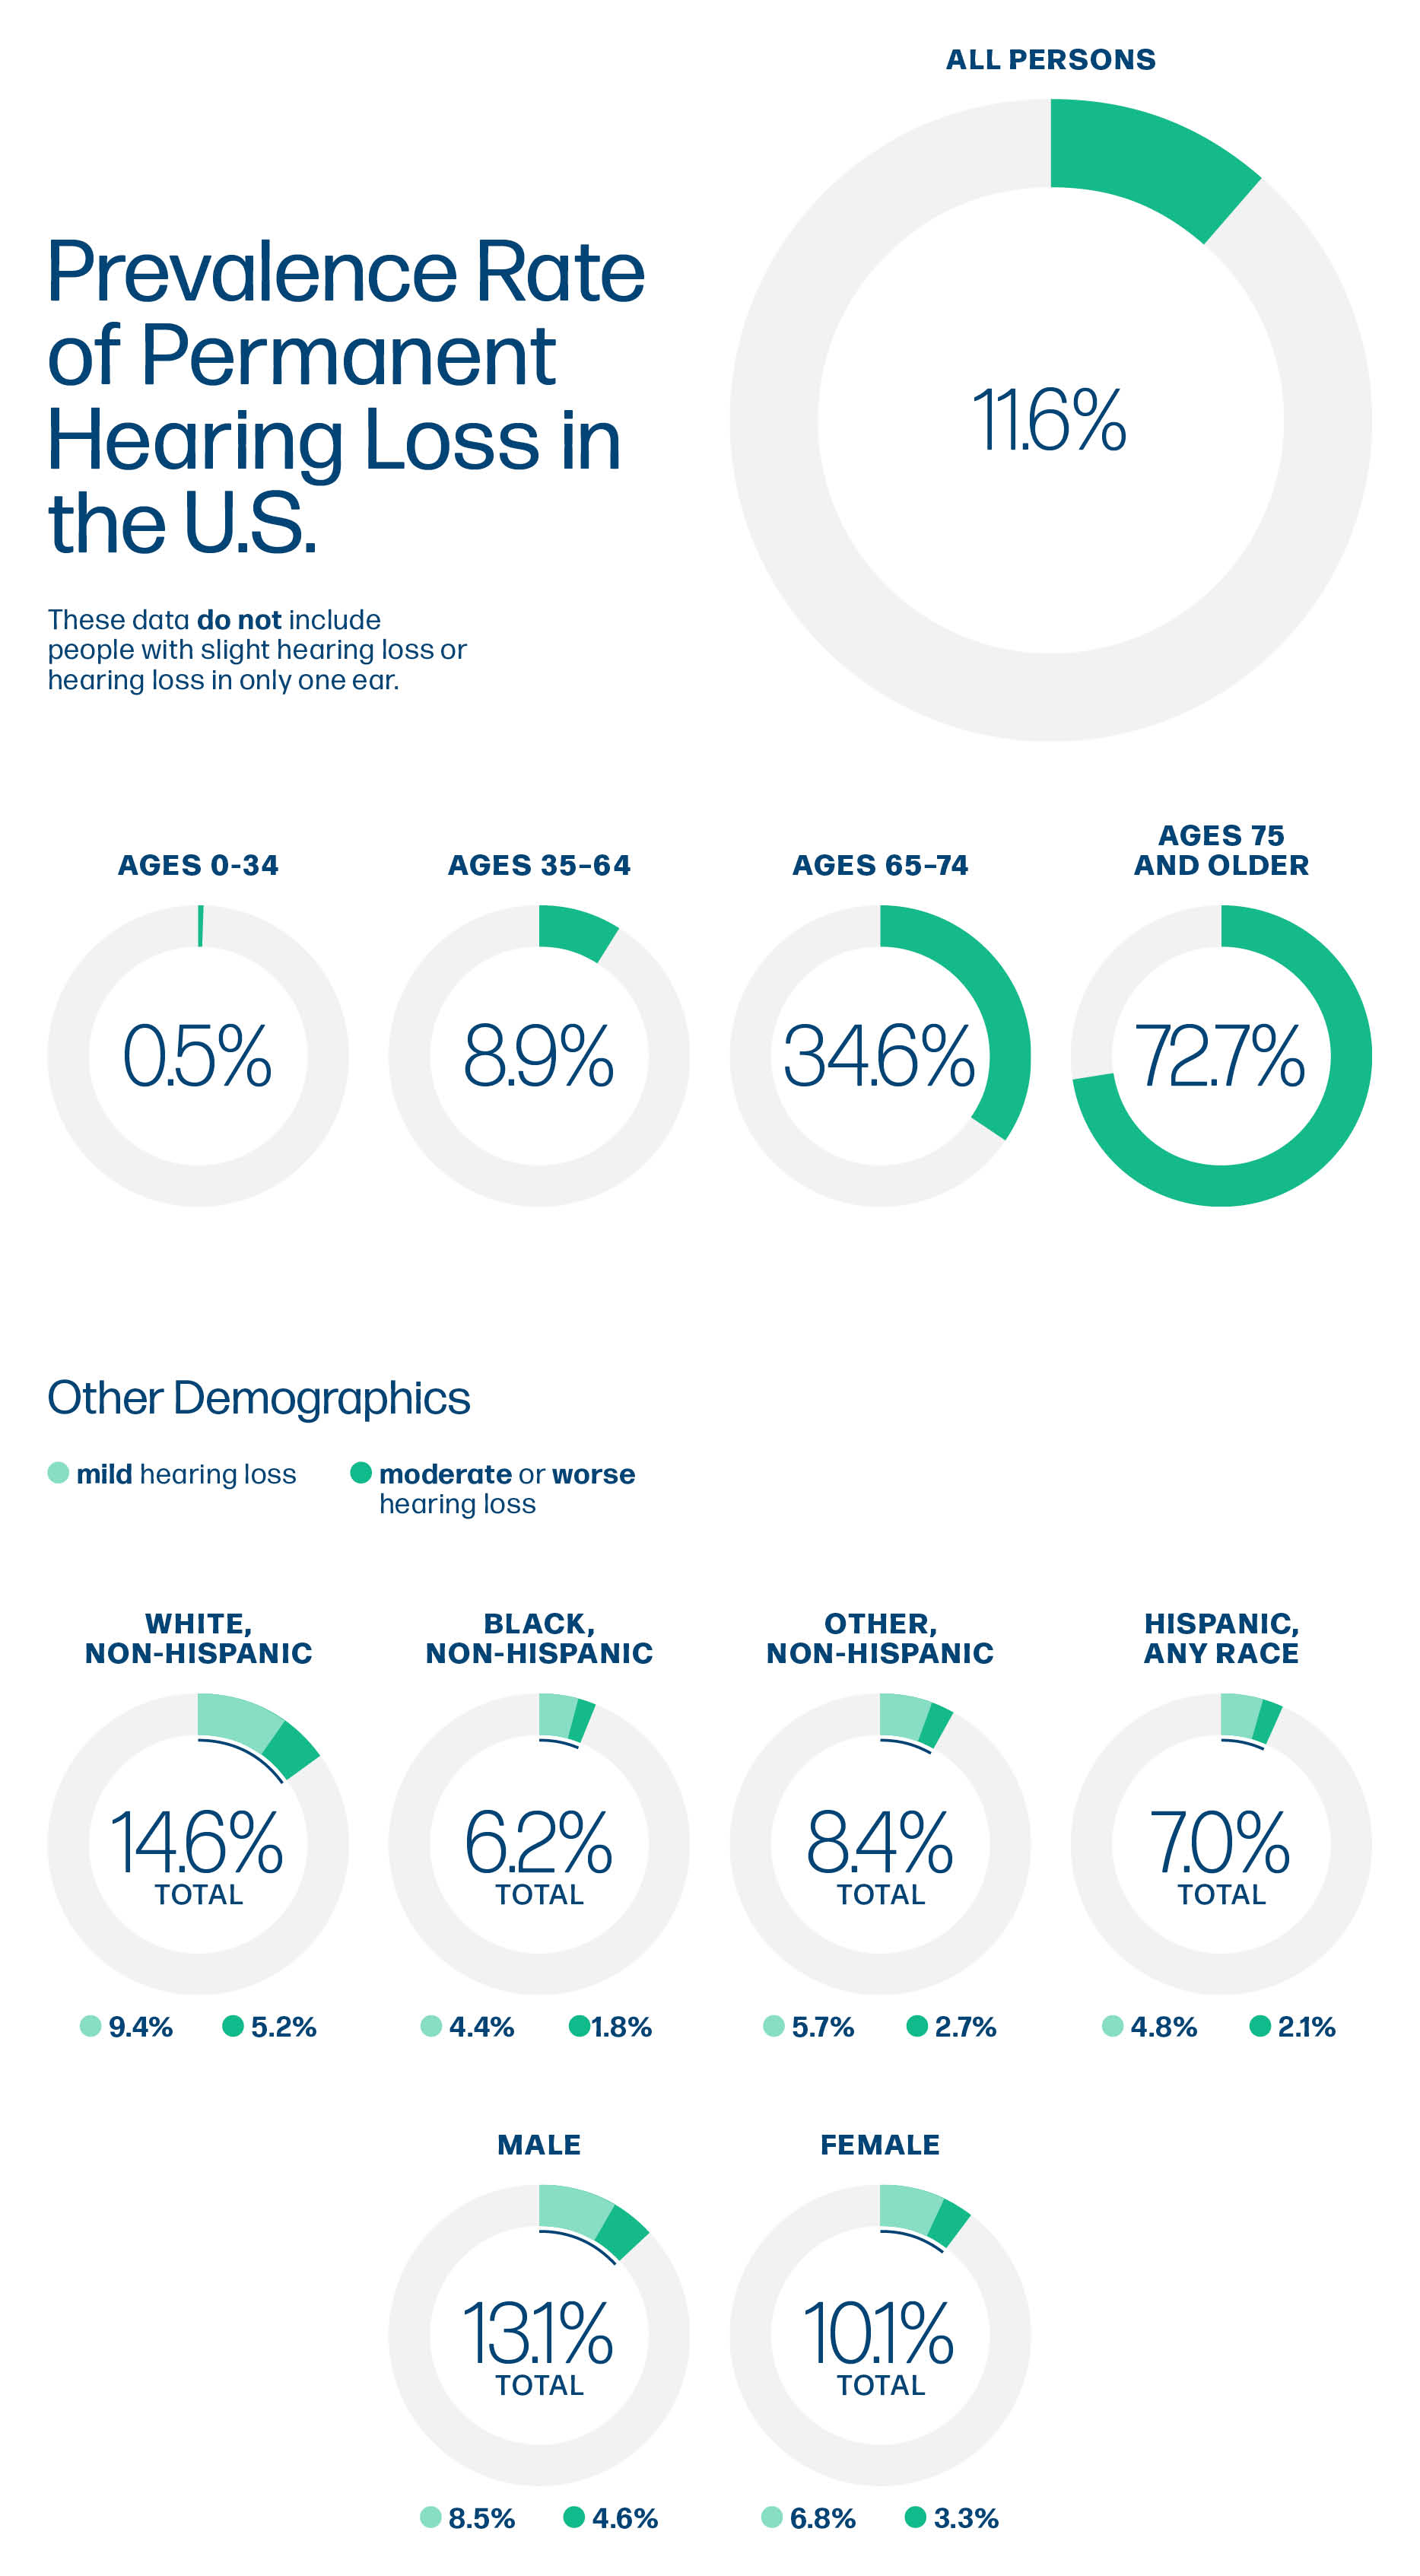
Hearing loss is a common and disabling condition. We estimate that in 2019, over 1 in 9 Americans (37.9 million, 95%CI 36.6-39.1 million) had bilateral (in both ears) hearing loss. The prevalence rate of hearing loss increases dramatically with age. Aging is the most important risk factor for hearing loss. However among people of the same age, rates of hearing loss are higher for men than for women, and for non-Hispanic Whites as compared to other race and ethnicity groups. Our study found higher rates of hearing loss in rural areas as compared to urban areas for reasons that are not currently well understood. Degrees of hearing loss are often defined based on hearing loss ranges measured in decibels in hearing level (dB HL). Using data from the National Health and Nutrition Examination Survey (NHANES), we categorized persons as having normal hearing (able to hear at or less than 25 dB), mild hearing loss (able to hear 26 to <=40 dB), or moderate or worse hearing loss (able to hear >40 dB) based on their hearing ability in the better hearing ear, corresponding to the American Speech-Language-Hearing Association (ASHA) definitions of normal and slight hearing loss (for normal), mild (for mild), and moderate, moderately severe, severe, and profound (for moderate or worse). The table and chart below show the percent of Americans that have mild and moderate or worse hearing loss, by age groups, race and ethnicity, and gender.
You can download a PDF of this graphic here.
| Mild | Moderate or worse | Total | |
|---|---|---|---|
| Ages 75 and older | 36.8% | 35.9% | 72.7% |
| Ages 65-74 | 24.6% | 10.0% | 34.6% |
| Ages 35-64 | 7.2% | 1.7% | 8.9% |
| Ages 18-34 | 0.6% | 0.1% | 0.7% |
| Ages 5-17 | 0.2% | 0.1% | 0.3% |
| Ages 0-4 | 0.1% | 0.0% | 0.1% |
| White, non-Hispanic | 9.4% | 5.2% | 14.6% |
| Black, non-Hispanic | 4.4% | 1.8% | 6.2% |
| Other | 5.7% | 2.7% | 8.4% |
| Hispanic, any race | 4.8% | 2.1% | 7.0% |
| Male | 8.5% | 4.6% | 13.1% |
| Female | 6.8% | 3.3% | 10.1% |
| All persons | 7.6% | 4.0% | 11.6% |
Overview
The national prevalence estimates are based on audiology examination data collected by the National Health and Nutrition Examination Survey (NHANES) audiology examination module. To ensure a sufficient sample size, we merged NHANES data from 2001-2012, and 2015-2018 (audiometry data were not collected in 2013/14) and updated the results to the 2019 U.S. population. These results are stratified by age groups, race/ethnicity group, and gender. NHANES data only reports national outcomes, and hearing examination data at the state or local level does not exist. To generate state and county prevalence estimates, we used a statistical modeling approach called small area estimation to predict the variation in prevalence of hearing loss in different geographic areas using state and county level data for different indicators of hearing loss which are available at the state and county level, including self-reported difficulty hearing as reported the American Community Survey and diagnosed hearing loss from Medicare fee-for-Service claims and Medicare Advantage encounters. A summary of the approach is in the table below.
Methodology | Predicted prevalence rates and prevalence counts using a statistical modeling approach. |
Data Sources |
|
Case Definitions |
|
Year | Released 2023, estimates based on 2019 population estimates. |
Publication | https://www.thelancet.com/journals/lanam/article/PIIS2667-193X(23)00244-2/fulltext |
Prevalence (number of people) with bilateral hearing loss in the United States:
Any bilateral hearing loss: 37.9 million (95% Uncertainty Interval [U.I.] 36.6-39.1)
Mild: 24.9 million (95% U.I. 23.6-26.0)
Moderate or worse: 13.0 million (95% U.I. 12.1-13.9)
Prevalence Rate (percentage of people) with bilateral hearing loss in the United States:
Any bilateral hearing loss: 11.6% (95% U.I, 11.2%-12.0%)
Mild: 7.6% (95% U.I, 7.2%-7.9%)
Moderate or worse: 4.0% (95% U.I, 3.7%-4.2%)
ᅠDisparities in hearing loss
Higher prevalence rates of hearing loss are associated with:
Increased age
Male gender
Non-Hispanic White race and ethnicity
Living in a rural county
| Prevalence Count | 2.5th precentile | 97.5th percentile | Prevalence Rate | 2.5th percentile | 97.5th percentile | |
|---|---|---|---|---|---|---|
| Total | 37,900,836 | 36,613,204 | 39,180,270 | 11.56% | 11.17% | 11.95% |
| Female | 16,774,227 | 15,898,329 | 17,639,868 | 10.08% | 9.55% | 10.60% |
| Male | 21,126,611 | 20,191,067 | 22,133,594 | 13.09% | 12.51% | 13.71% |
| 0 to 4 | 22,698 | 8,512 | 50,484 | 0.11% | 0.04% | 0.25% |
| 5 to 17 | 144,824 | 89,167 | 221,814 | 0.27% | 0.16% | 0.41% |
| 18 to 34 | 545,957 | 390,091 | 721,817 | 0.71% | 0.51% | 0.94% |
| 35 to 64 | 11,204,621 | 10,258,244 | 12,160,961 | 8.89% | 8.14% | 9.65% |
| 65 to 75 | 10,339,934 | 9,613,337 | 11,028,771 | 34.60% | 32.17% | 36.91% |
| 75+ | 15,642,790 | 15,167,163 | 16,150,353 | 72.71% | 70.49% | 75.06% |
| non-Hispanic Black | 2,469,030 | 2,260,799 | 2,731,955 | 6.18% | 5.66% | 6.84% |
| Hispanic | 4,289,275 | 3,939,998 | 4,623,767 | 6.95% | 6.38% | 7.49% |
| non-Hispanic Other | 2,445,071 | 2,206,101 | 2,709,664 | 8.40% | 7.58% | 9.31% |
| non-Hispanic White | 28,697,468 | 27,485,055 | 29,927,508 | 14.56% | 13.94% | 15.18% |
| Prevalence Count | 2.5th precentile | 97.5th percentile | Prevalence Rate | 2.5th percentile | 97.5th percentile | |
|---|---|---|---|---|---|---|
| Total | 24,894,276 | 23,624,225 | 26,019,499 | 7.59% | 7.20% | 7.94% |
| Female | 11,260,337 | 10,458,329 | 12,043,736 | 6.76% | 6.28% | 7.23% |
| Male | 13,633,940 | 12,732,822 | 14,534,255 | 8.45% | 7.89% | 9.00% |
| 0 to 4 | 18,353 | 7,622 | 35,846 | 0.09% | 0.04% | 0.18% |
| 5 to 17 | 102,485 | 58,346 | 160,800 | 0.19% | 0.11% | 0.30% |
| 18 to 34 | 467,652 | 330,941 | 615,442 | 0.61% | 0.43% | 0.81% |
| 35 to 64 | 9,045,363 | 8,164,261 | 9,922,030 | 7.18% | 6.48% | 7.87% |
| 65 to 75 | 7,341,236 | 6,676,021 | 7,957,312 | 24.57% | 22.34% | 26.63% |
| 75+ | 7,919,177 | 7,420,148 | 8,454,503 | 36.81% | 34.49% | 39.30% |
| non-Hispanic Black | 1,745,705 | 1,556,345 | 1,964,979 | 4.37% | 3.90% | 4.92% |
| Hispanic | 2,972,611 | 2,656,633 | 3,301,814 | 4.82% | 4.30% | 5.35% |
| non-Hispanic Other | 1,658,358 | 1,432,497 | 1,898,352 | 5.70% | 4.92% | 6.52% |
| non-Hispanic White | 18,517,606 | 17,408,145 | 19,581,264 | 9.39% | 8.83% | 9.93% |
| Prevalence Count | 2.5th precentile | 97.5th percentile | Prevalence Rate | 2.5th percentile | 97.5th percentile | |
|---|---|---|---|---|---|---|
| Total | 13,006,560 | 12,187,678 | 13,870,352 | 3.97% | 3.72% | 4.23% |
| Female | 5,513,890 | 4,947,514 | 6,103,386 | 3.31% | 2.97% | 3.67% |
| Male | 7,492,670 | 6,863,602 | 8,137,918 | 4.64% | 4.25% | 5.04% |
| 0 to 4 | 4,345 | 447 | 16,868 | 0.02% | 0.00% | 0.08% |
| 5 to 17 | 42,339 | 18,975 | 76,116 | 0.08% | 0.04% | 0.14% |
| 18 to 34 | 78,305 | 34,420 | 146,556 | 0.10% | 0.05% | 0.19% |
| 35 to 64 | 2,159,259 | 1,722,767 | 2,629,672 | 1.71% | 1.37% | 2.09% |
| 65 to 75 | 2,998,698 | 2,577,583 | 3,472,618 | 10.03% | 8.63% | 11.62% |
| 75+ | 7,723,613 | 7,228,648 | 8,241,711 | 35.90% | 33.60% | 38.31% |
| non-Hispanic Black | 723,325 | 585,385 | 864,432 | 1.81% | 1.47% | 2.16% |
| Hispanic | 1,316,664 | 1,126,662 | 1,529,346 | 2.13% | 1.83% | 2.48% |
| non-Hispanic Other | 786,713 | 616,087 | 960,841 | 2.70% | 2.12% | 3.30% |
| non-Hispanic White | 10,179,862 | 9,410,484 | 11,000,457 | 5.16% | 4.77% | 5.58% |
| State | Mild | Moderate or worse | Any |
|---|---|---|---|
| AK | 8.7% | 3.5% | 12.3% |
| AL | 8.7% | 4.3% | 13.0% |
| AR | 9.9% | 4.8% | 14.8% |
| AZ | 8.5% | 4.6% | 13..1% |
| CA | 6.3% | 3.4% | 9.8% |
| CO | 7.4% | 3.7% | 11.1% |
| CT | 6.9% | 3.9% | 10.8% |
| DC | 4.2% | 2.0% | 6.3% |
| DE | 6.9% | 3.9% | 10.8% |
| FL | 8.3% | 4.8% | 13.2% |
| GA | 6.5% | 3.2% | 9.7% |
| HI | 8.0% | 4.6% | 12.6% |
| IA | 8.1% | 4.4% | 12.5% |
| ID | 9.3% | 4.6% | 13.8% |
| IL | 6.6% | 3.6% | 10.2% |
| IN | 8.3% | 4.2% | 12.5% |
| KS | 8.7% | 4.4% | 13.1% |
| KY | 10.0% | 4.7% | 14.8% |
| LA | 7.9% | 3.8% | 11.7% |
| MA | 7.1% | 4.0% | 11.0% |
| MD | 5.9% | 3.1% | 9.1% |
| ME | 10.6% | 5.5% | 16.2% |
| MI | 8.2% | 4.3% | 12.5% |
| MN | 7.7% | 4.1% | 11.8% |
| MO | 8.9% | 4.5% | 13.4% |
| MS | 8.1% | 3.9% | 12.0% |
| MT | 10.3% | 5.2% | 15.4% |
| NC | 7.8% | 3.9% | 11.7% |
| ND | 8.3% | 4.4% | 12.7% |
| NE | 8.3% | 4.3% | 12.6% |
| NH | 8.7% | 4.5% | 13.3% |
| NJ | 5.9% | 3.4% | 9.4% |
| NM | 10.0% | 5.0% | 15.0% |
| NV | 8.3% | 4.1% | 12.4% |
| NY | 6.3% | 3.5% | 9.8% |
| OH | 8.2% | 4.3% | 12.4% |
| OK | 10.0% | 4.8% | 14.8% |
| OR | 9.7% | 4.8% | 14.5% |
| PA | 8.3% | 4.5% | 12.8% |
| RI | 7.8% | 4.2% | 12.1% |
| SC | 7.9% | 4.0% | 11.9% |
| SD | 8.9% | 4.6% | 13.5% |
| TN | 8.9% | 4.4% | 13.3% |
| TX | 6.9% | 3.3% | 10.3% |
| UT | 6.1% | 3.0% | 9.1% |
| VT | 10.0% | 5.1% | 15.1% |
| VA | 6.9% | 3.6% | 10.5% |
| WA | 8.3% | 4.1% | 12.4% |
| WI | 7.9% | 4.2% | 12.1% |
| WV | 12.3% | 6.0% | 18.2% |
| WY | 10.4% | 4.9% | 15.3% |
The Sound Check map can display more detailed state and county-level results. The table below summarizes the information available at the state and county levels. To view detailed state and county-level results, click on a state or county and then click on “VIEW DETAILS”
Available Stratifications | |
|---|---|
Stage |
|
Age Group |
|
Sex |
|
Race/Ethnicity |
|
Characteristic Overlays at the State and County Levels
The SoundCheck map allows users to select an overlay which displays as a purple dot over each geographic area (state or county). The size of the dot corresponds to the relative value of the overlay indicator. That is, the bigger the dot, the higher that characteristic at that geographic level. Overlay indicators are characteristics of the overall population of the state or county including those with and without hearing loss. For example, selecting the ‘Completed College’ overlay under ‘Educational Attainment’ produces purple dots over each state or county, with the size of each dot corresponding to the relative percent of people within that state or county who reported completing college.
To view definitions of each characteristic, please click on the "Data Sources" tab at the top of the Map Page (2nd from the right).
Available Map Overlays | |
|---|---|
Audiologists |
|
Self-Reported Disability |
|
High-Risk Occupation Rate |
|
Socio-Demographic |
|
Economic |
|
How To Treat or Manage Hearing Loss
Questions to Ask Your Patients About Hearing Loss
A Guide for Primary Care Physicians: Helping Patients With Hearing Loss Navigate New Hearing Aid Options
Hearing Loss Patient Poster